
What Is an Operational Intelligence Dashboard?
Organizations generate large volumes of operational data every day from cameras, machines, sensors, access systems, and business applications. While this information is valuable, it is often spread across multiple platforms, making it difficult for managers to gain a complete view of operations. Switching between different systems can delay decision-making and increase the time required to identify issues that need attention.
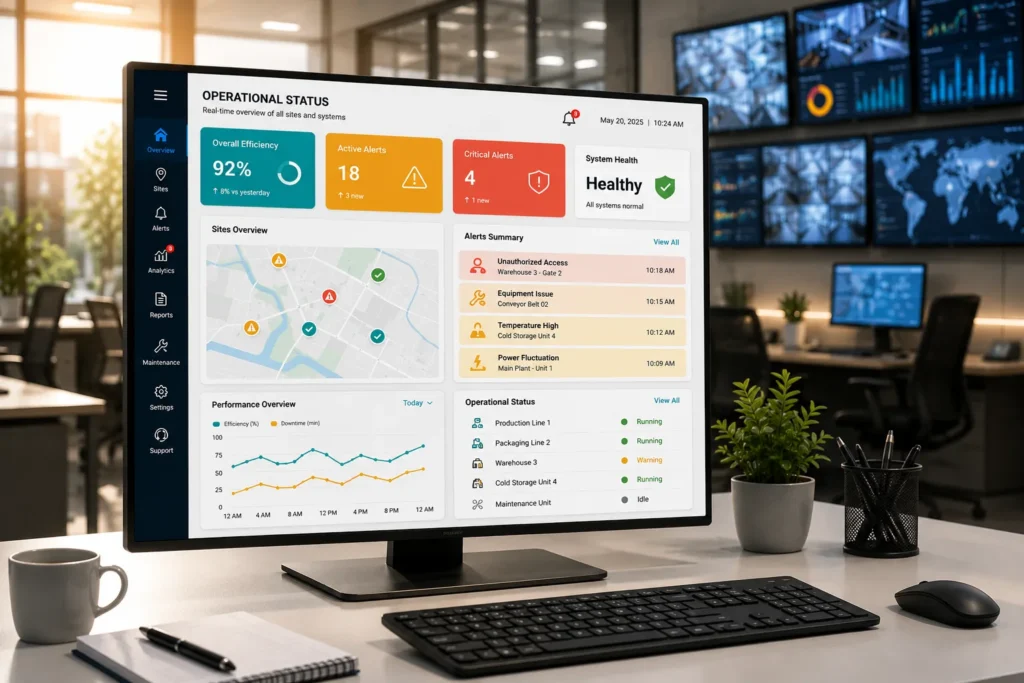
An Operational Intelligence Dashboard addresses this challenge by bringing important operational information into a single interface. It consolidates real-time data, alerts, performance metrics, and operational trends, allowing decision-makers to monitor business activities from one centralized location.
How an Operational Intelligence Dashboard Works
Instead of displaying information from only one source, the dashboard continuously collects data from connected systems and presents it in an easy-to-understand format.
A typical workflow includes:
Stage | Dashboard Function |
Data Collection | Receives information from cameras, AI analytics, sensors, and connected systems. |
Data Processing | Organizes incoming information into meaningful operational metrics. |
Event Prioritization | Highlights alerts and exceptions that require attention. |
Visualization | Displays dashboards, charts, maps, and live operational status. |
Decision Support | Helps managers evaluate situations and determine appropriate actions. |
Reporting | Stores operational history for analysis and performance tracking. |
This continuous flow of information enables faster operational awareness across the organization.
What Makes a Dashboard Effective?
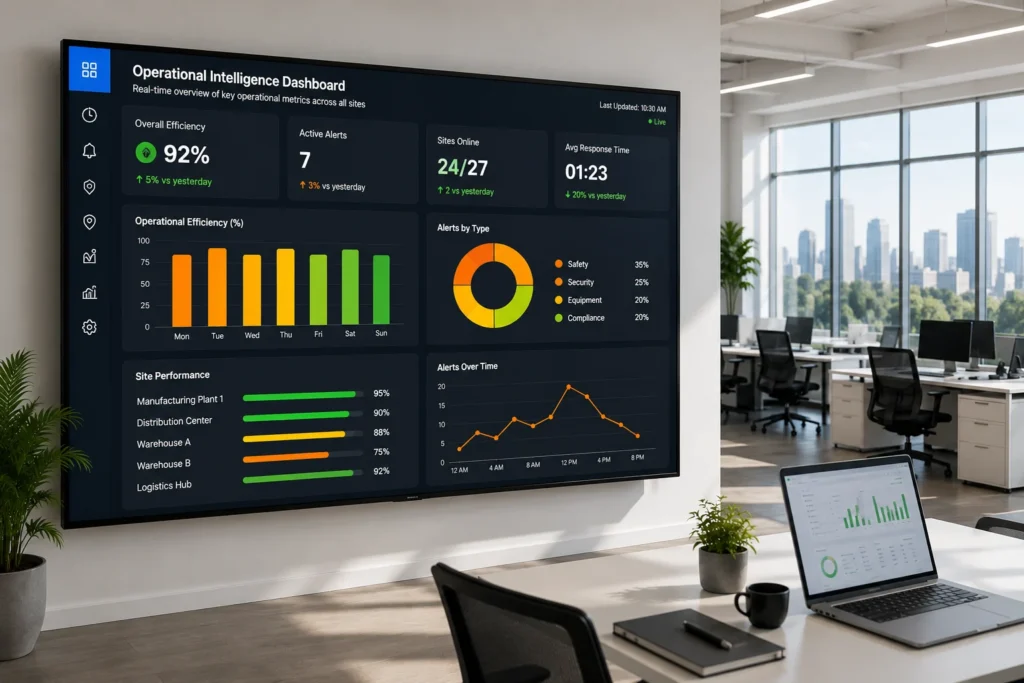
Not every dashboard provides meaningful operational value. An effective dashboard should focus on actionable information rather than displaying excessive amounts of data.
Important characteristics include:
- Clear visual organization.
- Real-time updates.
- Configurable performance indicators.
- Role-based access to relevant information.
- Easy navigation.
- Prioritized alerts.
- Support for historical analysis.
- Integration with existing enterprise systems.
A dashboard should simplify decision-making rather than add complexity.
What Information Can Be Displayed?
The exact content depends on business requirements, but an Operational Intelligence Dashboard typically combines multiple operational indicators within a single screen.
Examples include:
- Live operational alerts.
- AI-generated event notifications.
- Safety compliance status.
- Equipment activity.
- Occupancy and people counts.
- Access control events.
- Incident summaries.
- Site health indicators.
- Camera status.
- Performance trends.
- Task completion progress.
- Multi-site operational overview.
Presenting these insights together reduces the need to monitor multiple independent applications.
Key Components of an Effective Dashboard
Component | Purpose |
Live status panel | Displays current operational conditions. |
Alert center | Highlights incidents requiring immediate attention. |
KPI widgets | Tracks operational performance indicators. |
Trend charts | Shows changes over time. |
Interactive maps | Displays activity across facilities or zones. |
Event timeline | Organizes recent operational events chronologically. |
Search and filters | Helps users quickly locate specific incidents or data. |
A well-designed dashboard emphasizes clarity so that important information can be understood at a glance.
Benefits for Daily Operations
Operational Intelligence Dashboards help organizations improve visibility across complex environments.
Some practical advantages include:
- Centralized monitoring of multiple systems.
- Faster identification of operational issues.
- Reduced dependence on manual reporting.
- Improved coordination between departments.
- Better visibility across multiple locations.
- Quicker response to alerts.
- Simplified performance tracking.
- Easier management of historical operational data.
These benefits support more informed and timely operational decisions.
Choosing the Right Performance Metrics
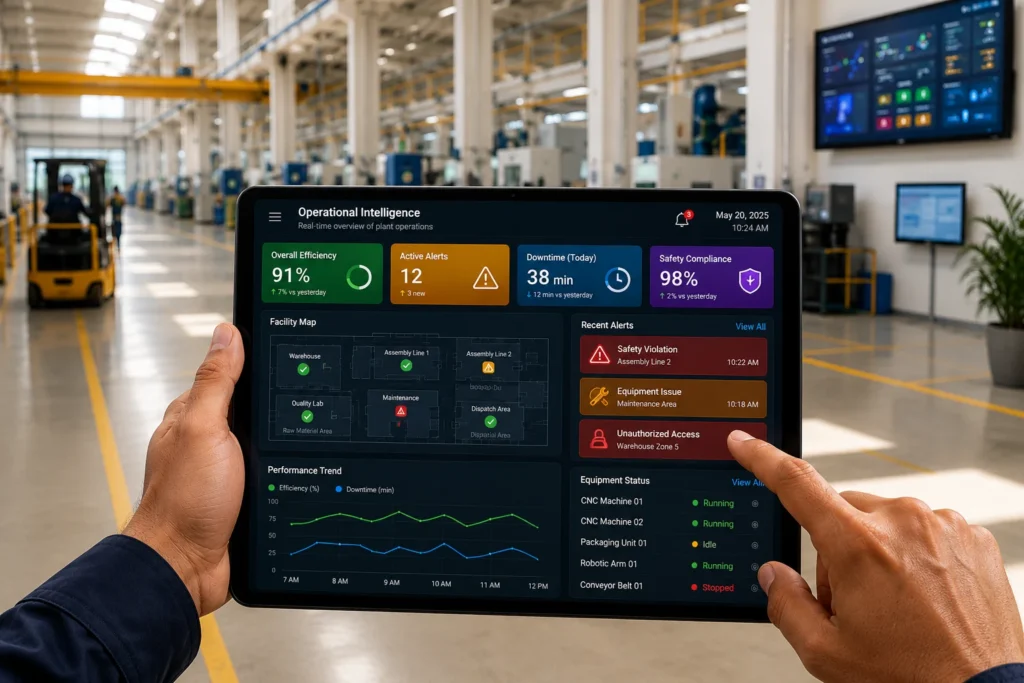
Selecting the right KPIs is essential for making the dashboard useful.
Organizations commonly monitor:
- Active incidents.
- Response time.
- Compliance rate.
- Equipment utilization.
- Workplace safety events.
- Operational downtime.
- Alert resolution time.
- Site availability.
- Productivity indicators.
- Repeat operational issues.
KPIs should align with operational objectives and provide measurable business insights.
Turning Operational Data Into Actionable Insights
An Operational Intelligence Dashboard serves as a centralized view of business operations, transforming information from multiple systems into meaningful insights that support faster and more effective decision-making. By combining live monitoring, AI-generated events, operational metrics, and historical trends within a single interface, organizations gain greater visibility into their operations while improving responsiveness, coordination, and overall operational performance.
Frequently Asked Questions
Is an Operational Intelligence Dashboard the same as a reporting dashboard?
No. Reporting dashboards primarily summarize historical information, while Operational Intelligence Dashboards combine real-time monitoring with historical insights to support immediate operational decisions.
Can the dashboard display information from multiple facilities?
Yes. Many platforms provide centralized dashboards that combine operational data from multiple sites into a single interface.
Can dashboards be customized for different users?
Yes. Organizations can often configure dashboards so that managers, supervisors, and executives view information relevant to their responsibilities.
Does the dashboard only display AI analytics?
No. It can combine AI-generated events with data from cameras, sensors, access control systems, equipment, and other enterprise applications.
How does an Operational Intelligence Dashboard improve decision-making?
By presenting real-time operational information, alerts, KPIs, and historical trends in one place, it enables managers to identify issues quickly and make informed decisions based on current operational conditions.