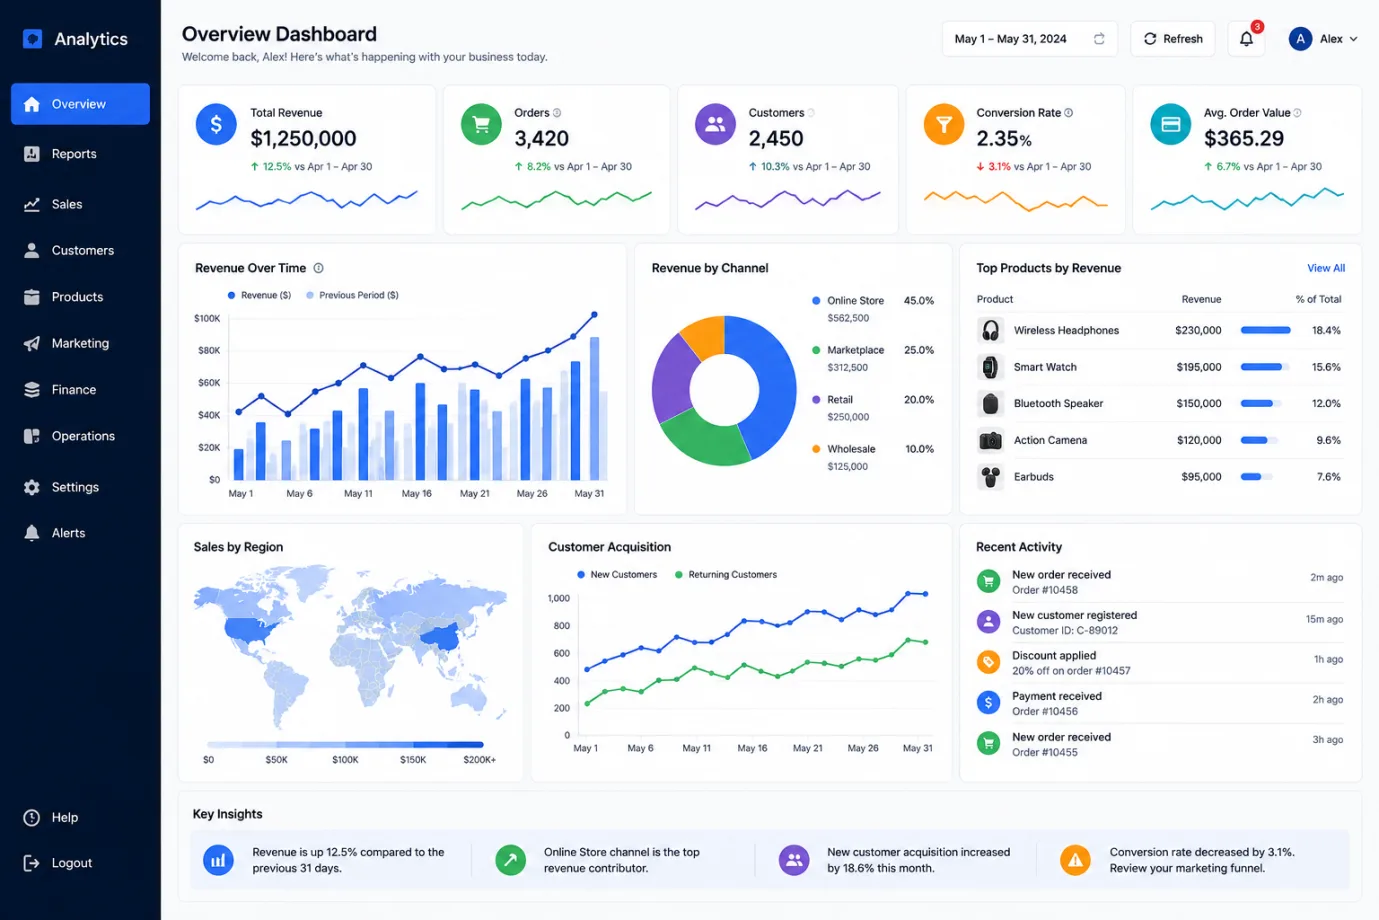
An analytics dashboard is a visual interface that brings together data from one or more sources and presents it through charts, graphs, tables, metrics, and other visual elements. It allows users to monitor important measures, identify trends, compare performance, and investigate changes without working directly with raw datasets. Dashboards can be configured for specific roles, business functions, or operational needs.
A sales dashboard might track pipeline value, conversion rates, revenue, and target attainment, while an operations dashboard could monitor production output, downtime, or service levels. Interactive features such as filtering, drill-downs, and real-time updates make dashboards useful for both routine monitoring and data-driven decision-making.